2023 will be 1982 all over again
What a difference a year makes. In my predictions for 2022 I had put one last sentence at the end of my final paragraph that stated:
“Bottom line, my prediction for 2022 is simple. It will be much like 2021, with record-breaking amounts of home sales, more record-breaking home price appreciation, and more buyers fighting over homes. These three things are all but certain to happen in 2022. Although interest rates could change things late in the year.”
It’s a good thing that I included that last sentence about interest rates because sure enough, they changed things. I said that because I knew they would likely work their way back up in 2022 but I will admit I didn’t see the possibility of them going up as fast as they did. It was quite clear by the time we entered June and rates went up over 6% that we were in for an adjustment year. Adjustment years tend to happen every 8-10 years for the market to reset for its next decade-long run.
Note: These 2023 predictions and observations apply nationally on many levels. Though real estate markets can vary from one local market to another, the majority of the overarching market trends are happening everywhere on a grander scale right now. For those reading these predictions outside of New England or South Florida, much of this will likely be applicable to your market unless you are in a unique place with outlying factors.
2022 Recap
If you look at 2022, even though December numbers won’t be final until the end of the month, it’s safe to say that sales will be down for the year as monthly sales were down year over year for 10 months and once December is in it will officially be 11 months. We must remember that roughly 10 to 12% of the home sales decline for 2022 is due to the extra, frenzied home sales in 2021. Comparing 2022 year over year to 2021 is almost unfair because 2021 had more home sales than any year since 2005 both nationally with over 6 million sales and in all the states we operate in – Massachusetts, New Hampshire, Rhode Island, Connecticut, Maine and Florida.
The typical seasonal pattern is for sales to trail off in the last three months of the year. What’s off trend this year, is that December is going to likely see better sales than November as rates fell into the low 6%’s in early November. This helped unfreeze the market somewhat for a few weeks, which will, as a result, help December sales which will still be down but not down as much as they were headed for. But all of 2022 being down over 2021 is really a combination of the market deceleration due to demand destruction (lower affordability and higher rates), the traditional seasonal slowdown, and the unusually high base from last year. It’s a perfect storm for sales to get crushed and the media to eat it up.
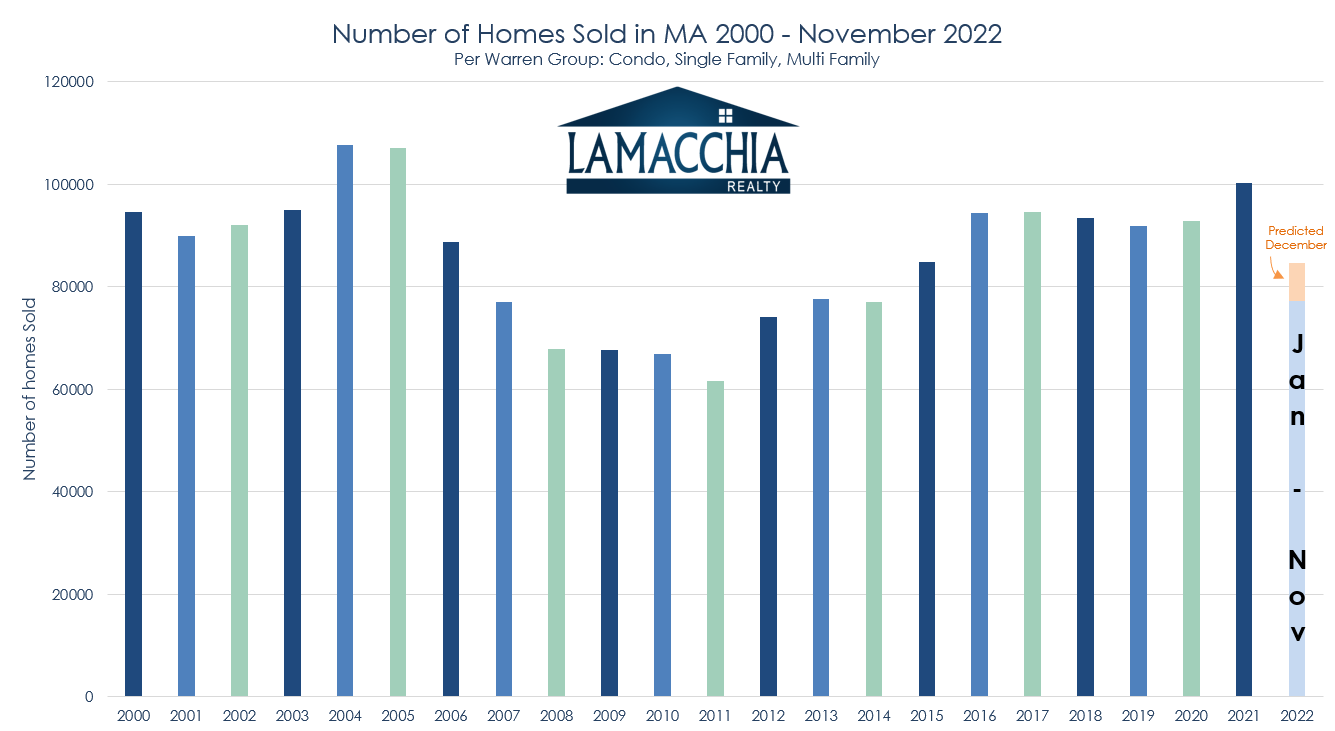
Below is a bar graph of homes sales per year in Massachusetts back to 2000. As you can see:
- This year will have the least amount of home sales since 2015
- 2021 sales were the highest since 2005
- We also added our prediction for the end of 2022
What Does This Mean for 2023 Home Sales?
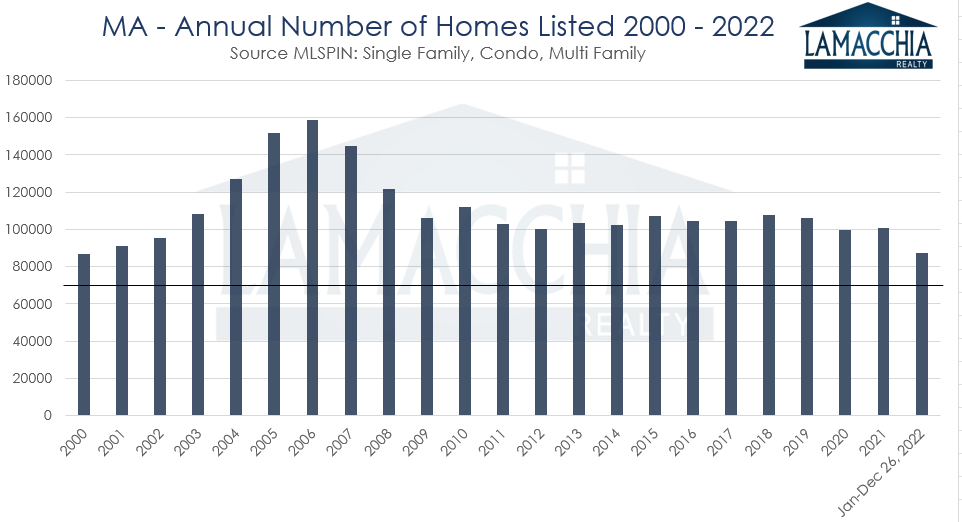
You can infer from the subtitle “2023 Will be 1982 all over again” that I’m clearly expecting an early 1980’s scenario, when inflation ran up causing interest rates, including mortgage rates, to spike. It’s amazing how history repeats itself, but with nuanced differences. People continue to compare what’s going on to 2008, but that’s not the case. At that time we had an extreme overabundance of sellers and not enough motivated buyers. Right now, there’s undoubtedly not as many buyers as there were over the past few years. But there’s also a lack of sellers because people are reluctant to give up their low mortgage interest rates. 2022 in Massachusetts alone, as an example, marked the least number of homes listed for sale than any other year since 2000. That is an extraordinary statistic and has kept inventory very low.
This graph below shows the number of homes listed per year in Massachusetts since 2000. You can clearly see that the year 2000 was the last time so few homes were listed.
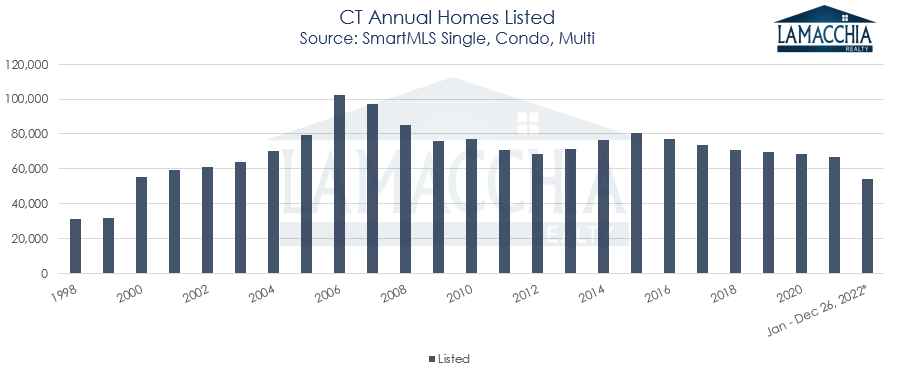
The story is similar in Connecticut. The chart below reveals homes listed, and as you can see it’s also down to its lowest level since 2000 just like in Massachusetts.
Owners who are locked into rates between 2 and 4% don’t want to walk away from them and they’re not going to for a while unless they have to. Therefore, most would-be sellers are in a holding pattern. I believe that we will see this continue over the next 18 months. Of course, with life changes such as growing families, empty nesters, sickness, divorce, retirement, relocations for careers, as well as first-time homebuyers, of which there is a constant new supply, the need for real estate transactions will never stop. Therefore, real estate, despite tricky market adjustments like this, never comes to a complete halt but it has slowed down for the reasons I have described. 2023, I expect, will be the slowest year of this cycle, just like it was in 1982. Nationally, I expect under 4 million home sales. We haven’t seen home sales that low since 2011 and we may even beat that and go lower.
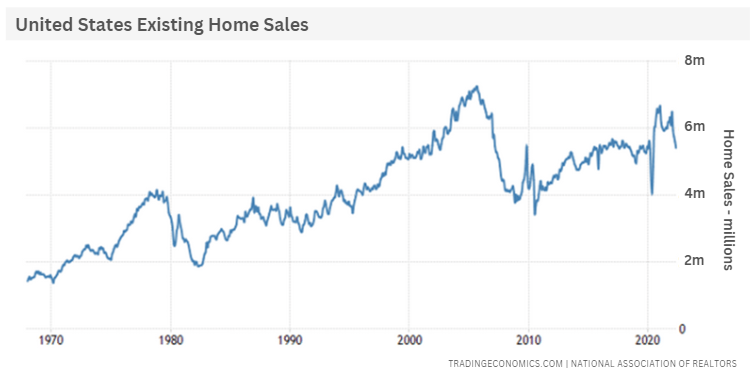
If you look at the graph below, you can see the drop in sales in the early 80’s and then you’ll notice there hasn’t been a time with lower sales since. Sales went down about 50% from their peak of around 4 million sales in the late 70’s down to 2 million in 1982. I do not expect home sales to drop by 50%, because interest rates are not 19% as they were then, but I do expect a decrease in 2023.
10-12% of the sales in 2021 were excess, or you could call it ‘froth’ and that’s important because it’s going to explain a portion of the decrease, we are seeing in 2022. As this is an adjustment year, 2022 is going to land somewhere around 15-20% lower total home sales in northern states from 2021 and about 10% of that is just coming down off the extreme high last year. In states like Florida, sales will be down more like 25% plus.
Now that we are adjusting back down from the frenzy, we must ask what will happen to 2023 if 2022 is going to be lower than 2021. My overall prediction is that home sales will be down somewhere around 8-12% for 2023 when compared to 2022. As markets do in all phases of economics, we are going to see a classic over-correction due to a lack of buyers as well as a lack of sellers who are holding off selling.
Allow me to elaborate further on how 2023 will flow. From about January 10th to April 15th multiple offers will make a comeback especially in northern states, and many buyers will wish they bought this past fall. To be clear, multiple offers will reappear more than what we saw in the past six months, but not nearly to the level of 2021 and early 2022. This is sure to happen because buyers always come out in droves after the new year and many sellers make the mistake of waiting until spring or even late spring to list. The sellers who list in the winter always make the most money. This period will make many think that the market adjustment and slowdown is behind us forever and they will be wrong. It will be a two-to-three-year adjustment that ebbs, and flows based on the season.
By spring, as more homes are listed, the multiple offers will retract because supply will increase, and demand will begin to decrease as buyers get their homes. Things will begin to even out between buyers and sellers from April to July. Homes sales will be down during this period compared to the same period in 2022. Then from July to September more homes will get listed and those sellers will be mad that they cannot sell for what they saw their neighbors sell for who listed in the winter and early spring. Fall will bring about a deceleration like this past fall and sales will be flat compared to 2022 to finish out the year. Again, we will end 2023 with sales being down somewhere between 8-12% compared to 2022; but if you compare it to 2021 sales will be down about 25% so it will be a substantial change. Again that’s in northern states.
In places like Florida, it will be more dramatic because the Sun Belt had such an incredible run up in sales following the pandemic as many migrated to the warmth during the ‘work from home’ phase.
South Florida single families exhibited its largest increase in sales in 2021 in ten years and condo sales had the largest increase in 2021 that we have on record. Single family sales increased by 13% over 2020 totaling in 53,765 sales and condos blew 2021 out of the water with a 52% increase, closing 63,499 sales. The atmospheric increase of condo sales over 2020 is attributed to the fact that in 2020 during COVID, many were searching for single families instead of condos to find more space and stay away from communal living due to covid which kept 2020 condo sales lower than usual and made the 2021 jump seem even higher.
Below is a bar graph that illustrates the number of condo and single families per year in South Florida since 2009. As you can see 2021 was just an incredibly historic year. Please note 2022 only goes from January to November since December numbers aren’t out yet so those 2022 bars will end a bit higher.
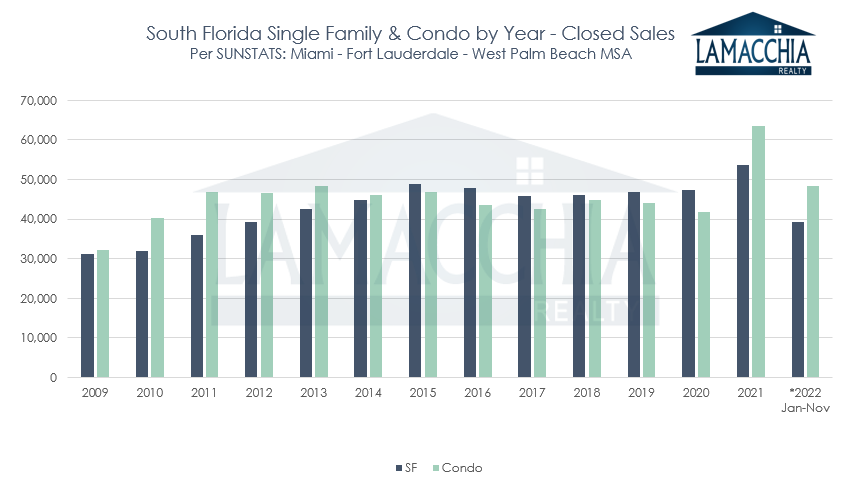
If you combine single families and condo sales in 2021 (117,264) and compare that amount to 2020 (89,324), there was a 31.3% increase in total sales year over year. Up to the end of November 2022, without December accounted for, we are at 87,459 total sales which is 25% lower than 2021. It is our educated guess that South Florida will close the year out with roughly 92,360 total sales and so 2022 will end with about 21% fewer total sales than 2021.
Ending this year with an estimated 21% decrease and applying a similar market paradigm that we predicted for Massachusetts, sales for 2023 will also be down at least 13% but probably more in Florida because of the second home market and the condo market. First, buying a condo at all has been made more difficult due to the new condo guidelines as a result of the tragic Surfside collapse. There are more stringent guidelines and therefore it’s not as easy to get a sale done on a condo in an older, slightly less up-to-date building. Second of all, in April of 2022 the FHFA enacted changes to lending practices for second/vacation homes and raised rates to effectively treat the mortgage as if it’s an investment property making it more expensive. And finally, there will inevitably be a wave of sellers listing the homes they purchased during the pandemic as the ‘work from home’ paradigm has shifted back to ‘work from work’.
In South Florida we are already seeing an increase in listings that were purchased in the last two and a half years and are currently vacant. This will increase inventory in South Florida much faster than up in New England and most of the country. These homes won’t get as much use and these owners will want to offload the expense during a time when inflation is a factor and when renters are also tightening their belts. This presents a massive opportunity for buyers who have been dying to have more to choose from.
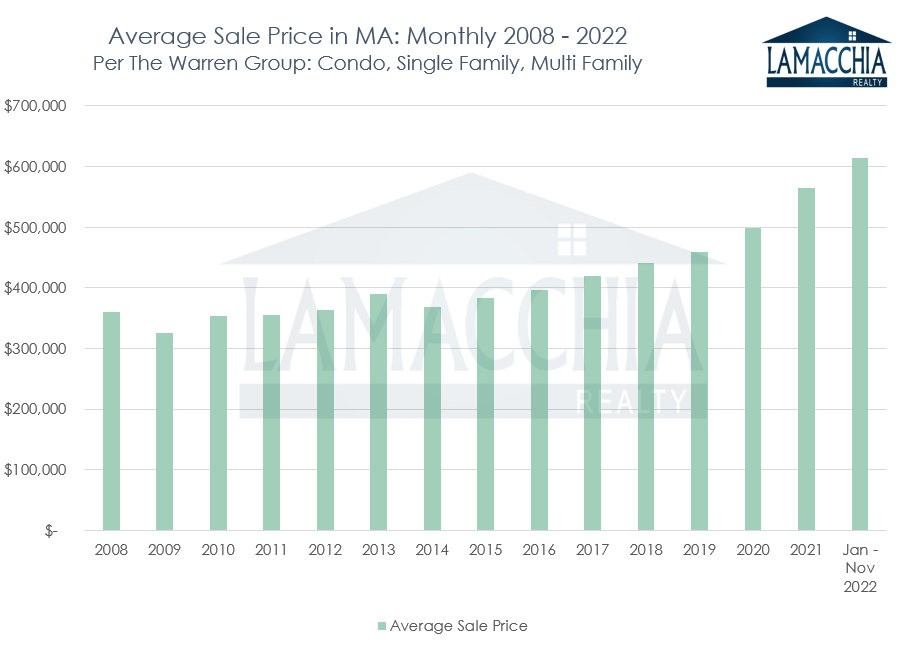
The Price of a Market Adjustment
By the time 2022 ends and the final numbers are in we will undoubtedly see that prices are up for 2022. In recent months, we saw prices continue to increase but not at the rate they’d been rising over the past few years. Rising rates slowed the climb and rising prices is a trend that will not continue.
At some point in early to mid-2023, we will see home prices begin to even out when compared year over year and then we will start to see a slight decline. A year from now when we measure the year of 2023 as a whole, I believe that prices will land somewhere between 3% down or 3% up, and that slight 6% swing, for all intents and purposes, is essentially flat and should be welcomed. A slide toward equilibrium is exactly what is necessary. Truthfully, prices going down more than that would be healthier for the market because affordability has just gotten too far out of reach for buyers. But with this incredible lack of sellers listing, it’s somewhat impossible for prices to fall out as they did in 2008 because there are simply not enough homes for sale. To give you an example of inventory, let’s measure.
Using Massachusetts as an example, as of December 26th, 2022, there were 6,293 homes for sale and on the same date in 2006 when the market really started to go south, there were 41,394 homes for sale. That is over 6.5 times the number of homes on the market then versus now. Supply was through the roof comparatively.
Nationally the story wasn’t much different in that the number of homes on the market was 3 times higher in December of 2006, at 3.81 million compared to now with 1.22 million available. With real estate propelled by supply and demand, the 2008 scenario overall was exacerbated by a historic number of homes for sale and that is clearly not the case now.
In Florida, prices will likely settle down more because they went up more than other states as you can see in this bar graph below. 2021 increased by 36% year over year for single families and by 34% year over year for condos. These were the largest year over year increases that we have on record. Those gains were due to the droves of buyers competing for homes with multiple over-asking offers. Demand was high, and prices rose as a result.
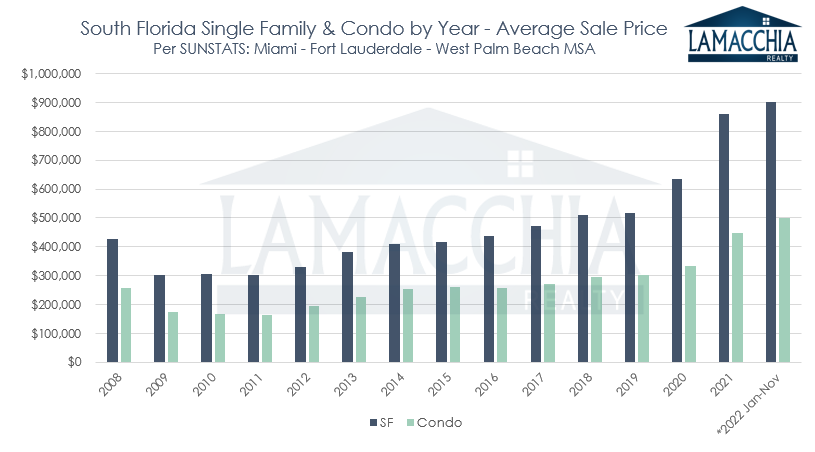
2022 is likely to end with prices for single families and condos respectively being similar or even a bit higher than 2021.
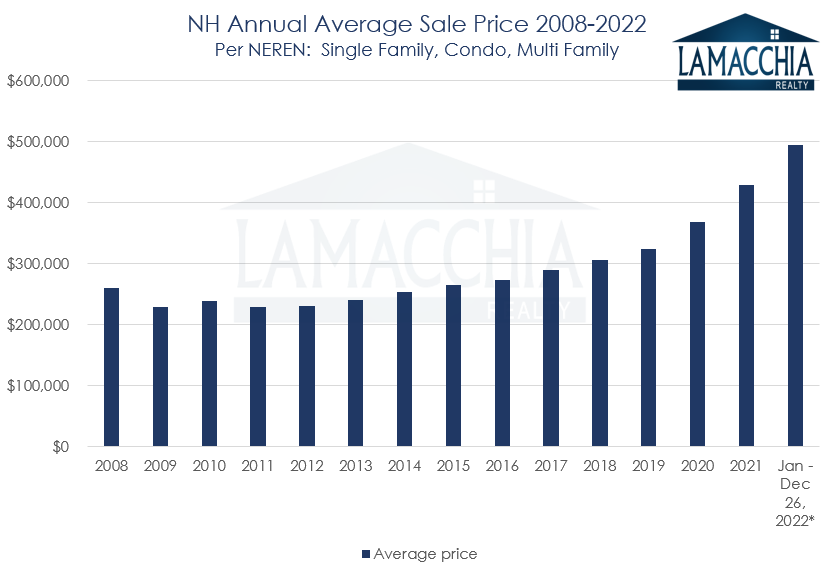
In the charts below, you’ll see that New Hampshire and Massachusetts prices in 2022 are still rising over 2021 without December even accounted for. As I said 2023 is predicted to show a slight 3% increase or decrease when compared to 2022, staying relatively flat year over year.
Mortgage Interest Rates
It’s very hard for anyone to predict future interest rates. There is a lot of optimism circling around about how quickly rates will start to decline to a more desirable level. In the last 6 or 7 weeks, they have settled down a bit into the mid-low 6’s which has been good news.
As we saw with the recent jobs report a couple of weeks ago, this economy is resilient and there is often a very delayed impact on things showing up in financial data. The Federal Reserve is going to stay on pace with raising their benchmark overnight interest rate but that doesn’t always have a direct correlation to long-term mortgage rates. Long-term mortgage rates are impacted by other factors, and I expect them to stay in the 6’s but more likely to rise into the 7’s again for a short period of time before they start to decline next summer and fall.
Many mortgage experts disagree with me and strongly feel that rates will continue their decline as they mostly have in the last 8 weeks due to inflation seeming to be backing off. I am not convinced that inflation is as good as recent reporting indicates. The strategic oil reserves were tapped into in the early fall to bring fuel prices down right around the midterms, but the drawdown ended in October of 2022. With final deliveries slated for this month, I won’t be surprised if we see oil prices go back up for a bit and force the Fed to continue raising rates. This would put upward pressure on all rates, which could include mortgage rates increasing as well. Additionally, with the economy in China turning back on, there will be more demand for fuel and goods which will increase inflation pressures.
I predict in about a year from now, rates will be lower than they are now but getting there may be a bit painful. Buyers need to keep that in mind along with the fact that there are creative mortgage options. Temporary Buydowns are an option where the payment is lower for the first years of a mortgage giving buyers better cash flow while they wait for an opportunity to hopefully refinance to a permanently lower rate. Another option is mortgage assumptions, where a seller can leverage their low rate for the buyer to purchase their home. The buyer will pay more for a home if their monthly payment is lower by assuming the seller’s rate. Sellers can sell and give up their low rate knowing they have a chance at assuming someone else’s low rate, which takes the sting out of it. Coming back to the forefront as well are adjustable-rate mortgages as a solid strategy to keep introductory rates lower in the first few years of a loan.
Conclusion
Buyers should embrace this time as they were dying for less competition, greater affordability, and some leverage with sellers. Now they have it! Everyone who is freaking out thinking this is another 2008 is going to realize that it isn’t, something I have been saying since the beginning of the Pandemic. Again, there aren’t nearly enough homes for sale, at least at this stage, for that to happen. This is an early 1980’s scenario where the amount of home sales will go down significantly for a year or two, but prices won’t really follow.
We may see that slight dip in prices I mentioned earlier, a welcome change, and this shouldn’t worry anyone. Real estate is a long game; an investment that generally grows long term. For those renting and waiting for a great price drop, you’ll end up spending more in rent than you would end up saving if prices dropped. Put it this way, a 3% price drop (which we may see next year) on a $500,000 house is $15,000 less, but you’re going to spend on average at least $24,000 renting (at $2,000/month and essentially paying someone else’s mortgage) while you wait for that to happen. Renters, would-be sellers, and buyers are all going to eventually get impatient and tired of waiting and they’re going to go out there and get the house they need. No matter what happens there will always be home buyers and always be home sellers. In real estate, the show must and always does go on!
Happy Holidays and Happy New year!
– Anthony Lamacchia, Broker/Owner, Lamacchia Realty.