

- Timing is everything when selling your home, and the next few months will
 be the best time to list your home. Anthony predicts that if you wait until spring to list, you may actually sell your home for less than your neighbor who chose to list in the wintertime. Anthony further explains why this is the number one time of year to sell your home in the video.
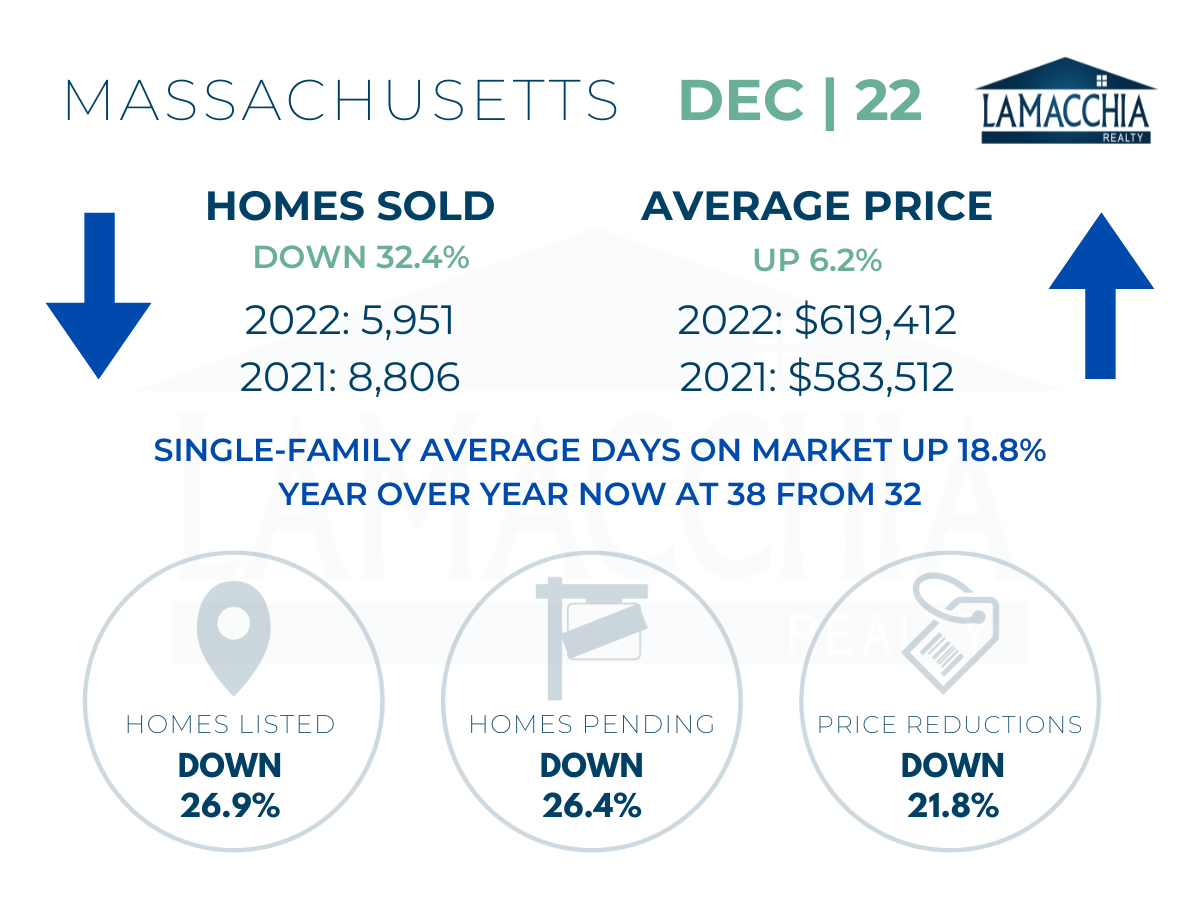
 - Listings & pendings were down compared to December 2021. This can mostly be attributed to normal seasonality, but numbers are lower than normal still since would-be sellers are staying put to keep their low rates 2-3% mortgage rate, and may be opting instead to renovate or expand their homes rather than sell.
- Mortgage rates remained consistently between about 6-6.5% in the month of December. For many buyers, increased mortgage rates reduced buyer affordability and took many out of the market completely. This can attribute to sales being lowered compared to December 2021.
- However, there are several mortgage options available to allow buyers to purchase a home at a lower-than-current rate, such as mortgage assumptions or buydowns. As always, there is a cost to waiting and it is better to be informed and prepared to get into the home you want as soon as possible!
- Prices have increased year over year, but the rate of increase is much smaller than what was seen in the beginning of 2022 – for reasons including rising inventory and mortgage rates starting in mid-2022. In Anthony’s 2023 predictions, he explains in depth where he thinks prices will go in 2023.

Our December 2022 MA | NH Housing Report
Massachusetts Home Sales Down 32.4% Sales are down 32.4% year over year, with December 2022 at 5,951 vs. 8,806 last December. Sales are down across
Our December 2022 MA | NH Housing Report
Massachusetts Home Sales Down 32.4% Sales are down 32.4% year over year, with December 2022 at 5,951 vs. 8,806 last December. Sales are down across